From UA to GA4: Dashboard Migration for Looker Studio
Table of Contents
- How to Connect GA4 Data to a Looker Studio Dashboard
- How the Metrics and Dimensions Differ
- How to Create a Custom Metric in Looker Studio
- Where did ‘Unique’ Metrics go?
- What are The New GA4 ‘Engagement’ Based Metrics?
- What do I Use for Reporting on User Pages / Screens?
- Where did Audience Segment Import Go?
- Reporting on Acquisition Data
- Pulling Event Data - No More Category/Action/Label
- Custom Creations Through Calculated Fields
- Why do Certain GA4 Dimensions & Metrics Not Apply Data?
- UA vs GA4: Beware of Discrepancies, and How to Combat Them
It’s one thing to migrate your existing Google Analytics Universal Analytics (UA) to the new, Google Analytics 4 property (GA4); it’s quite another to ensure your tracking is stable and comparable once you’re done. Along with that task come many others, whether you are creating new event tracking via Google Tag Manager, setting up conversions, building audiences, and more as part of your migration process. Often forgotten during the migration process to GA4 is the task to replicate your most-used dashboards that contained UA data - to now use GA4 data. This can be a daunting task; however, given things may not always be 1:1, this guide will walk through how to leverage the GA4 property data source for your Looker Studio reports.
Let’s walk through some GA4 data source nuances and tips which should help you excel at creating your favorite reports and dashboards in Looker Studio with ease.
How to Connect GA4 Data to a Looker Studio Dashboard
There can be some confusion on how to connect to a Google Analytics - Google Analytics 4 property data source within Looker Studio. It’s actually not very different from how you would connect to a Universal Analytics property currently.
Note: to connect a Google Analytics 4 property to a Looker Studio report, you need Read & Analyze permissions or higher to the specific property you wish to connect.
- Select the Google Analytics connector type
- Find and select your needed Google Analytics Account
- Select your Google Analytics 4 property needed
- Select the blue, “Add” button in the bottom right hand corner of the screen.
- Start Visualizing!
Look how easy that is—and not too different from what was done in the past with UA data. Although, the main difference in UA versus the GA4 data source for the connector is that within GA4 properties there are no “Views” anymore (with standard accounts). Because of this, when you connect to a GA4 property the only way to narrow down to mimic old Views is to create a filter to apply to the data visuals to get your View data. If you are a current Analytics 360 account, then you would be able to link as a data source your subproperty, if applicable to your current account structure.
For example, if you want to mimic an old North America traffic View from Universal Analytics, and are using your GA4 property; you will need to create a filter to apply to the report visuals which the filter only includes traffic from North America.
That said, you can start to get the wheels turning when you report on a GA4 property data source for how to set up filters within Looker Studio to mimic your UA Views, or even your GA4 data streams.
How the Metrics and Dimensions Differ
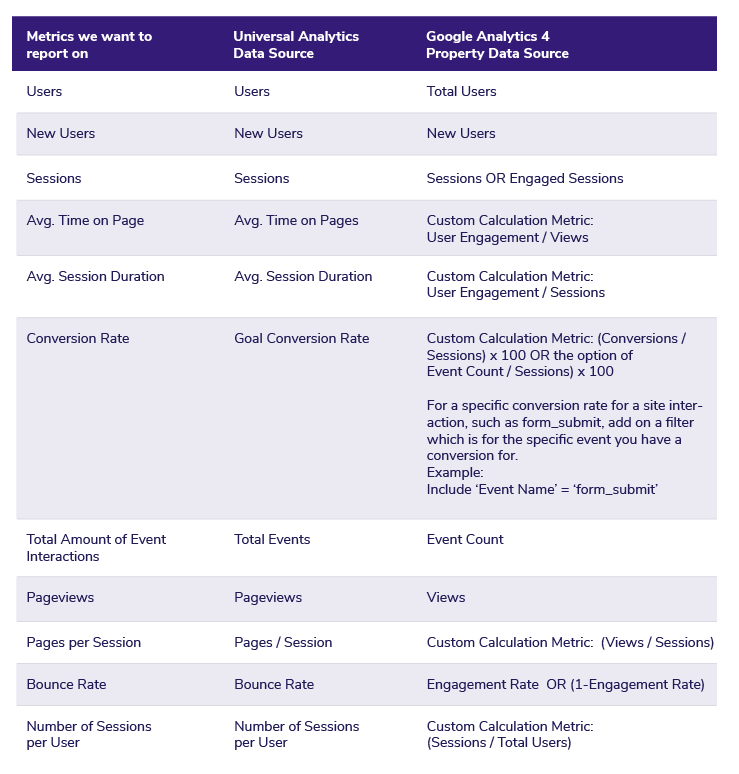
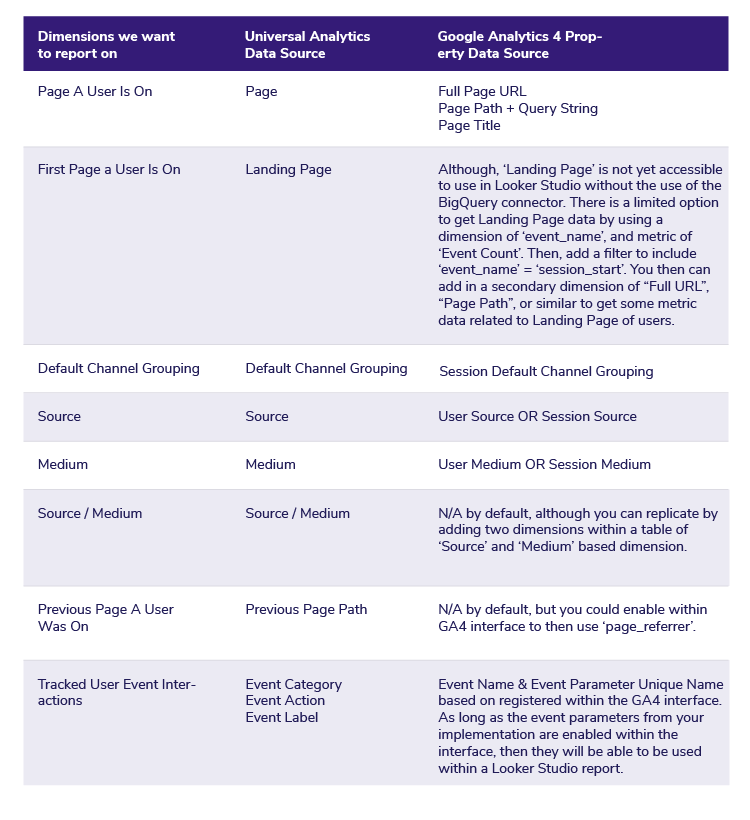
If you have migrated from UA to GA4, then you know how there is not only a new data tracking model, but also new dimensions & metrics to leverage. Google still provides the bulk of our fan favorite dimensions and metrics from UA, but now the name is slightly different. Some metrics from UA also do not exist by default in GA4, such as returning users, but they can be easily recreated when needed and there is great flexibility to create net new dimensions and metrics in GA4.
The table below shows the UA & GA4 equivalent of our most used dimensions & metrics. You may notice that they need to be created using a Looker Studio custom calculation metric and there will be included resource images to show how to set that up in the interface.
For a complete look at the GA4 available dimensions and metrics check out this Google resource. Also, check out this Google tool which allows you to view the UA and GA4 version of the dimensions & metrics side by side.
For more information on engagement rate, check out this page.
How to Create a Calculated Field in Looker Studio
For more information on landing pages, check out this resource.
Looking to enable custom definitions within the GA4 interface? Check out this resource.
Where did ‘Unique’ Metrics Go?
Within Universal Analytics, and even old dashboards you built out, you may have leveraged ‘unique’ metrics such as unique users, pageviews, and events. Within Google Analytics 4, you probably noticed that they don’t provide us with those metrics any longer. To provide some context, unique metrics were a way for us to de-duplicate multiple iterations of users, pageviews, and events - to get a more accurate number of the true amount that came or occurred on the site.
Then, you may be asking, “how can I get something similar to unique metrics within GA4”?
Well, the answer, quite honestly, could be an entirely separate article, but to get an accurate measure of individual users engaging across your site/or app, you would need to implement what is known as a User-ID. For more information, check out User ID Reporting Identity.
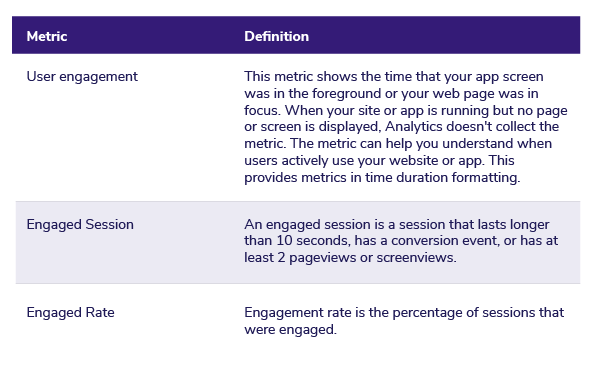
What are The New GA4 ‘Engagement’ Based Metrics?
Within Google Analytics 4, within base tracking they provide a handful of automatically tracked events; which includes ‘user_engagement’. This helps to provide us with engagement time (in milliseconds) when the app is in the foreground or webpage is in focus for at least one second. This provides us with a few new metrics which can be used for reporting. The other option is to make calculated metrics which aren’t provided out of the box such as ‘Avg. Time on Page’, ‘Engagement Rate’, and others.
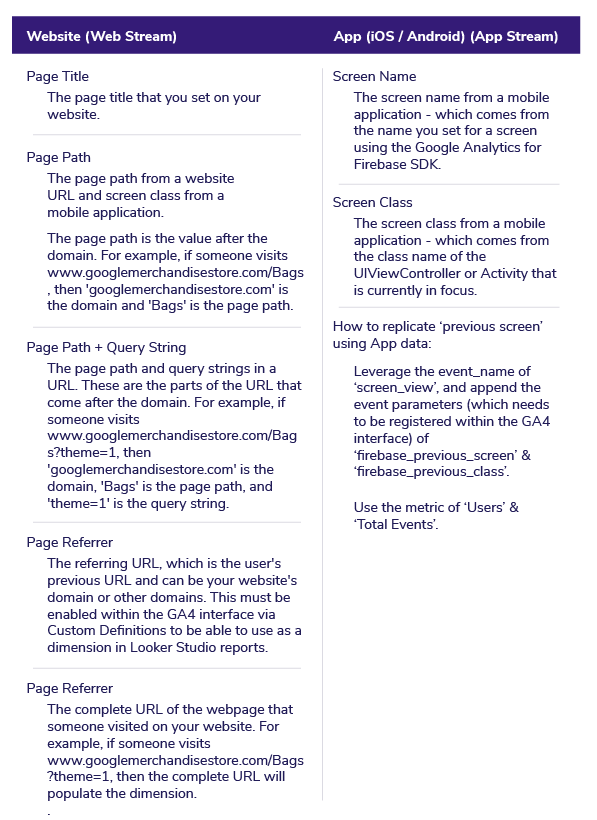
What do I Use for Reporting on User Pages/Screens?
Now that Google Analytics 4 supports web & app data, the interface provides more dimension options since users can view site pages, or app screens. This provides a handful of potential dimensions whether you have an app or a website (or both!) which you can use for your reporting needs. The ones you use come down to user preference for reporting, and also your applicable use cases for the reports you build out.
Where did Audience Segment Import Go??
Within Looker Studio when you use a GA4 data source connector, there is no Google Analytics segment import feature. With the UA data source, it allowed us to pull in audience segments that were created in the UA interface to then use for Looker Studio reports.
With the GA4 data source connector there will not be the ‘traditional’ audience segment import; although this can still be accomplished by pulling in audience segments to leverage in reporting. That is done by creating a filter which uses the dimension name of ‘audience name’ and then pulling in the Audience Name you created in the GA4 interface. This route allows you to apply the audience to any visual you create to essentially ‘segment’ the data.
Bonus Tip: You can also create a data control drop down - which the stakeholder, or end user of your dashboard can filter the report by whichever audience is applicable within the drop down you create.
The one main caveat to note about audiences within GA4 is that audiences will only start placing users into them from the day the audience is created and onward; therefore we need to remember this when reporting on historical data when audiences are being used and applied. Definitely consider making audience creation part of your GA4 migration process!
Reporting on Acquisition Data
Once you are set up on GA4, there are two different versions of acquisition data reports: first user & session based acquisition data. This is a huge benefit to having the data split out by first user and session based metrics for your marketing team’s tasks. Although, there can be some confusion around when to use each for various purposes, we will walk through them in detail below.
Within UA, there is just the singular, default scope option of viewing acquisition data based on the sessions that came to our website. Within GA4, there is the new concept of viewing acquisition data based on first time, new users OR based on sessions of all our users who came to our platforms.
First User Acquisition Dimensions & Metrics
Consider this:the first user is related to the new users that visit your site, or app. This is great for when you're looking at campaigns and marketing efforts and want to see how new users are being acquired and engaging with the site and or app, along with any conversions they may have had. The data within this report will provide metrics based on new users for whichever date range you have applied.
Dimensions and Metrics That Belong To First User Acquisition Data: User Source, User Medium, New Users, Engaged Sessions
Session Acquisition Dimensions & Metrics
This is a classic, default report for acquisition metrics used for looking across total traffic to see how users got to your platform, overall engagement, conversions, and more. This is still a great report and metrics to view when looking at marketing performance; although ideally this report is better for looking at the big picture of your marketing data across the site, or marketing campaign lifecycle.
Dimensions and Metrics That Belong To Session Acquisition Data: Session default channel grouping, Session source, Session medium, Users, Sessions
Pulling Event Data - No More Category/Action/Label
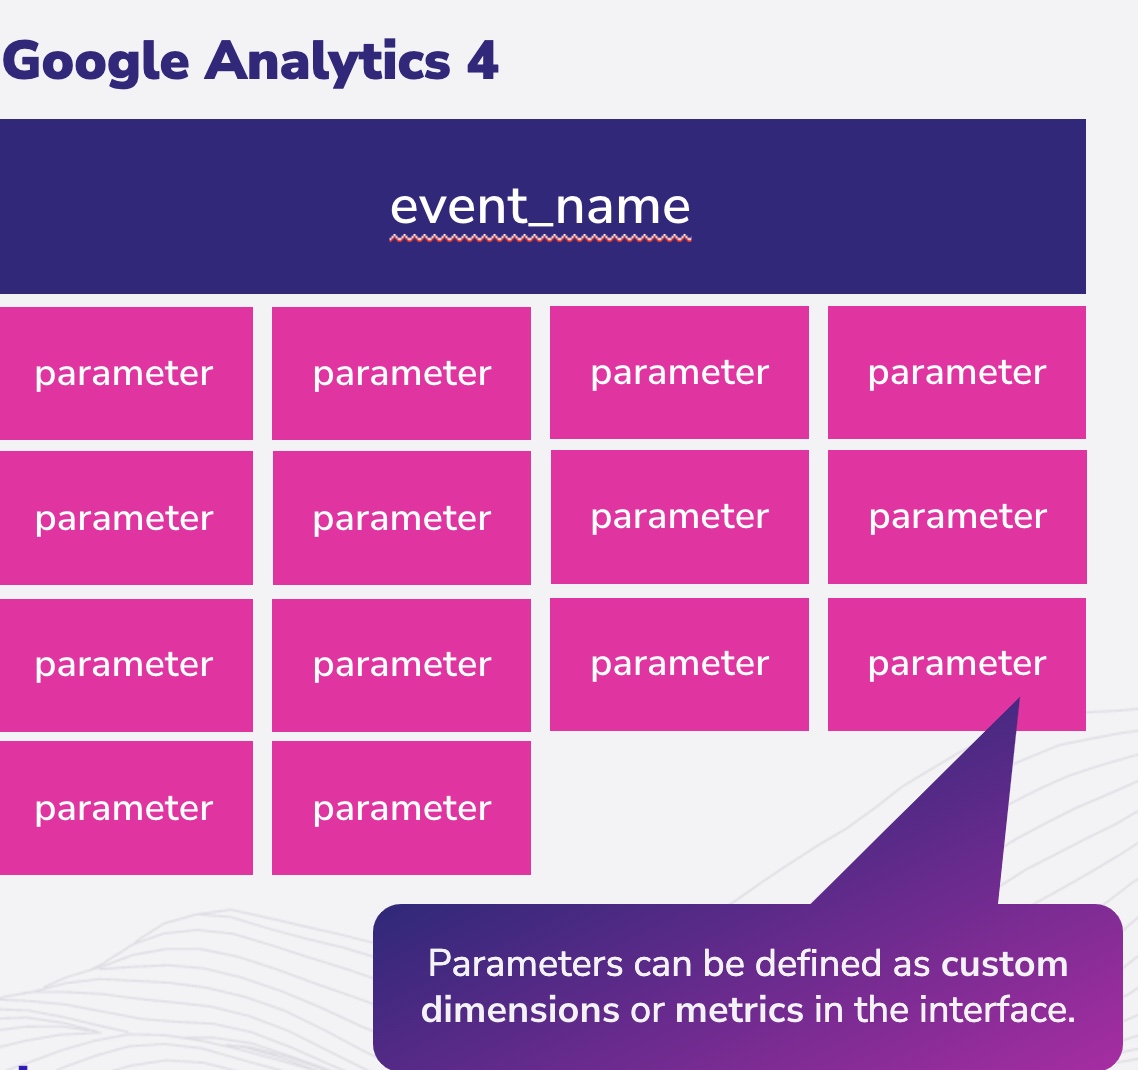
Within UA, the event tracking model included Event Category, Event Action, and Event Label for reporting on event data attributes & elements. GA4 has a new way for event tracking which includes dimensions of Event Name & Custom Definition Attributes which would be available for reporting on. This can be a bit different in terms of when to report on event data, as well. For reference, GA4 is all event data, even page_views. This is a more flexible data model and you can pick the aspects of the events that you want to report on. Think of events as the action you want to report on, such as button clicks, and custom dimensions and metrics attached to those events as what you want to know about the action, like the button that was clicked had the text of "buy now".
Here is an example, you want to visualize data for the event, ‘form_submit’, to see the custom definition for ‘form_inquiry_field’. To do this in Looker Studio with a GA4 data source you would do the following.
- Add a dimension of ‘
event name’. - Add a metric of ‘
event count’.
You will notice that this current set up will just provide you the total list of events you have tracked, and associated event counts. To get to the 'form_inquery_field' within the ‘form_submit’ event, you guessed it, you'll need to apply filters.
- Add an additional dimension of the specific event parameter you need - for example, in this use case add in the dimension of ‘
form_inquiry_field’. - Lastly, to clean this up - create a filter to include ‘
event name’ equal to ‘form_submit’.
This will then update our visual to include the dimensions of ‘form_submit’, associated ‘form_inquiry_fields’, and the event counts which equate to form submission counts per each form field attribute.
You can leverage these steps on essentially most visual charts in Looker Studio to report on multiple dimensions pertaining to specific or custom events.
Pro Tip: Be consistent with naming conventions! How you name your events and parameters in your implementation can impact your Looker Studio reports.
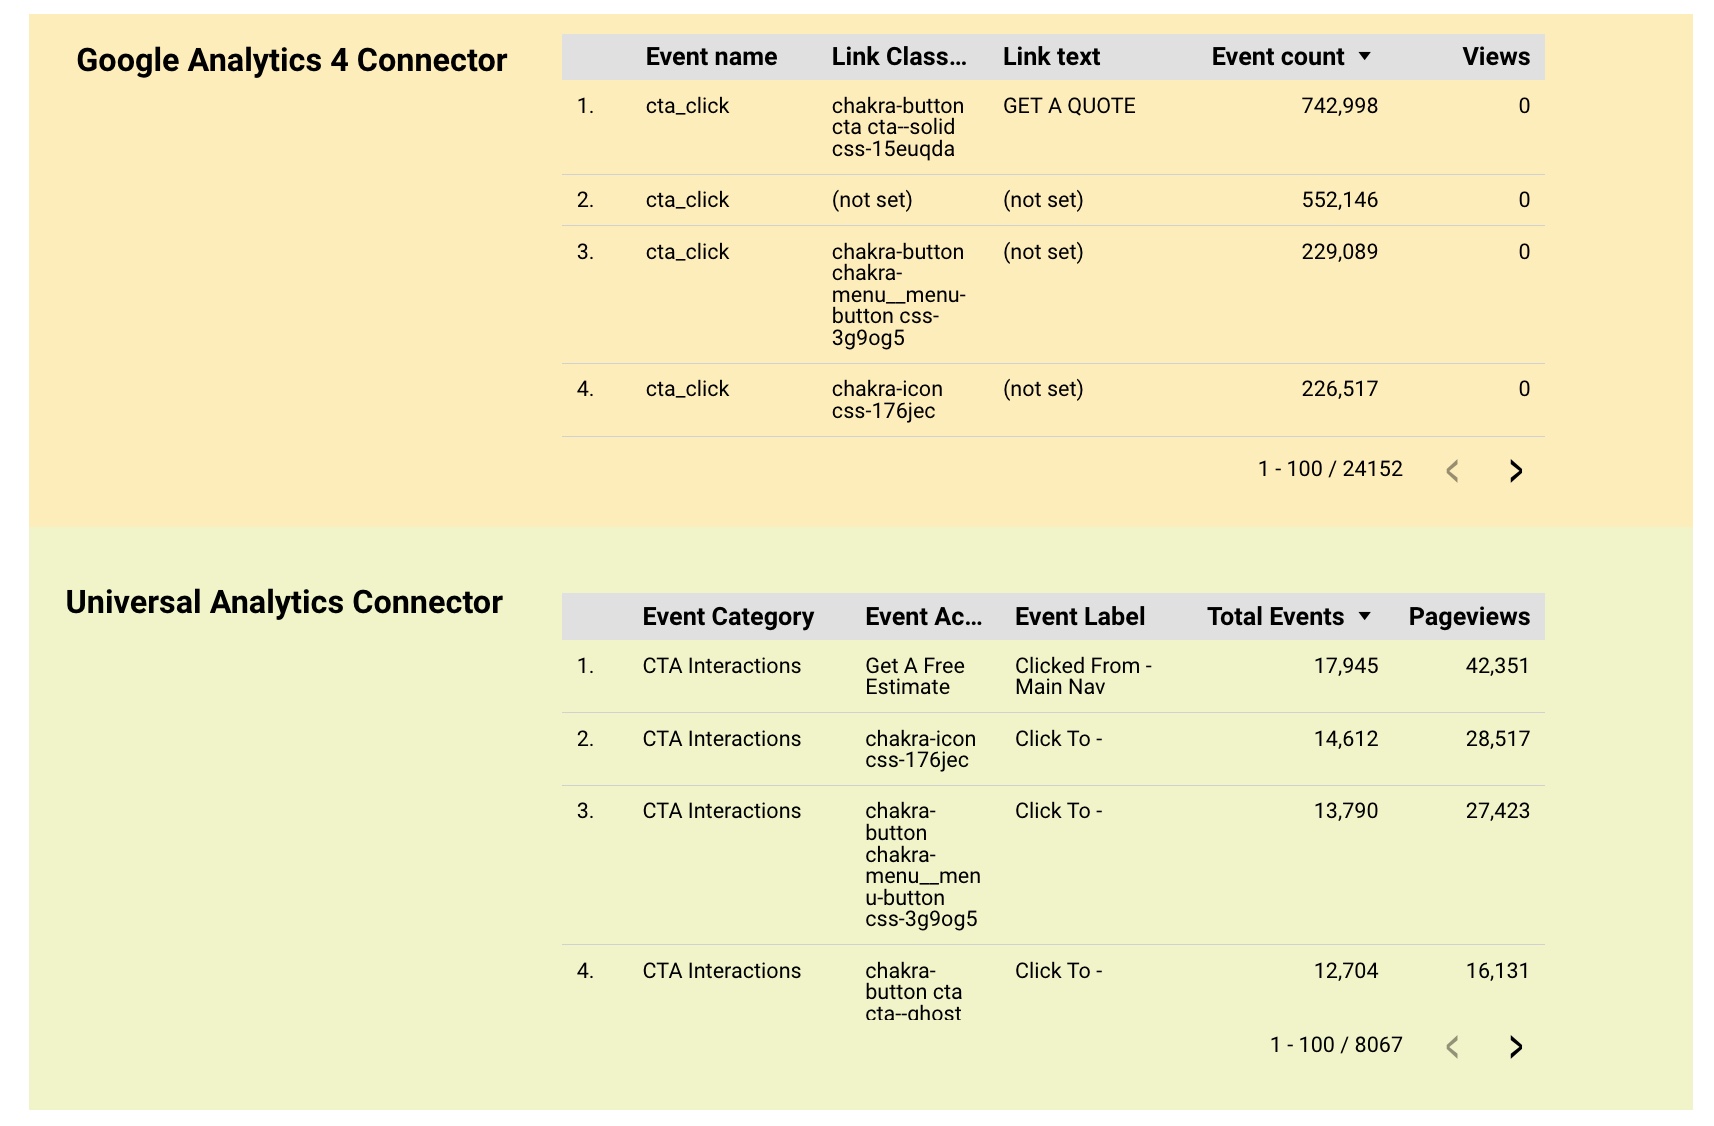
For example, you may want to report on ‘link_text’, but accidentally implemented variations of ‘link_text’ which are named differently from one another such as ‘link_click’, ‘cta_click’, ‘navigation_click’, ‘faq_click’, and others. By naming everything consistently, this will make it easier to track and manage what to use for reporting.
Custom Creations Through Calculated Fields
Another GA4 nuance, not unique to Looker Studio, is that some metrics are not available by default such as Avg. Time on Page, Avg. Session Duration, and a handful of others. This is where you can leverage calculated fields in Looker Studio which allows you to build out new, or even replicated metrics that you need for your dashboards. To take it up a notch, you can even leverage data blends which allows you to combine multiple data sources, to create custom data sets where you can apply custom calculated metrics.
For more information on calculated metrics, and data blends check out these resources:
- Data Blending Within Looker Studio
- Calculated Fields Within Looker Studio
- Enhance your Reports with Calculated Fields
Why do Certain GA4 Dimensions & Metrics Not Apply Data?
If you're not a newbie to Looker Studio, but navigating the migration to Google Analytics 4, then you may have built out a report where in Looker Studio the ‘historically’ acceptable dimension and metric combo “should” work to create the expected visual. With this new GA4 territory comes some learning curves. Similar to UA having what is known as “scope”, which is the characteristic of all dimensions and metrics, still exists within GA4.
For example, within GA4, dimension and metrics have the following scope:
- Event
- User
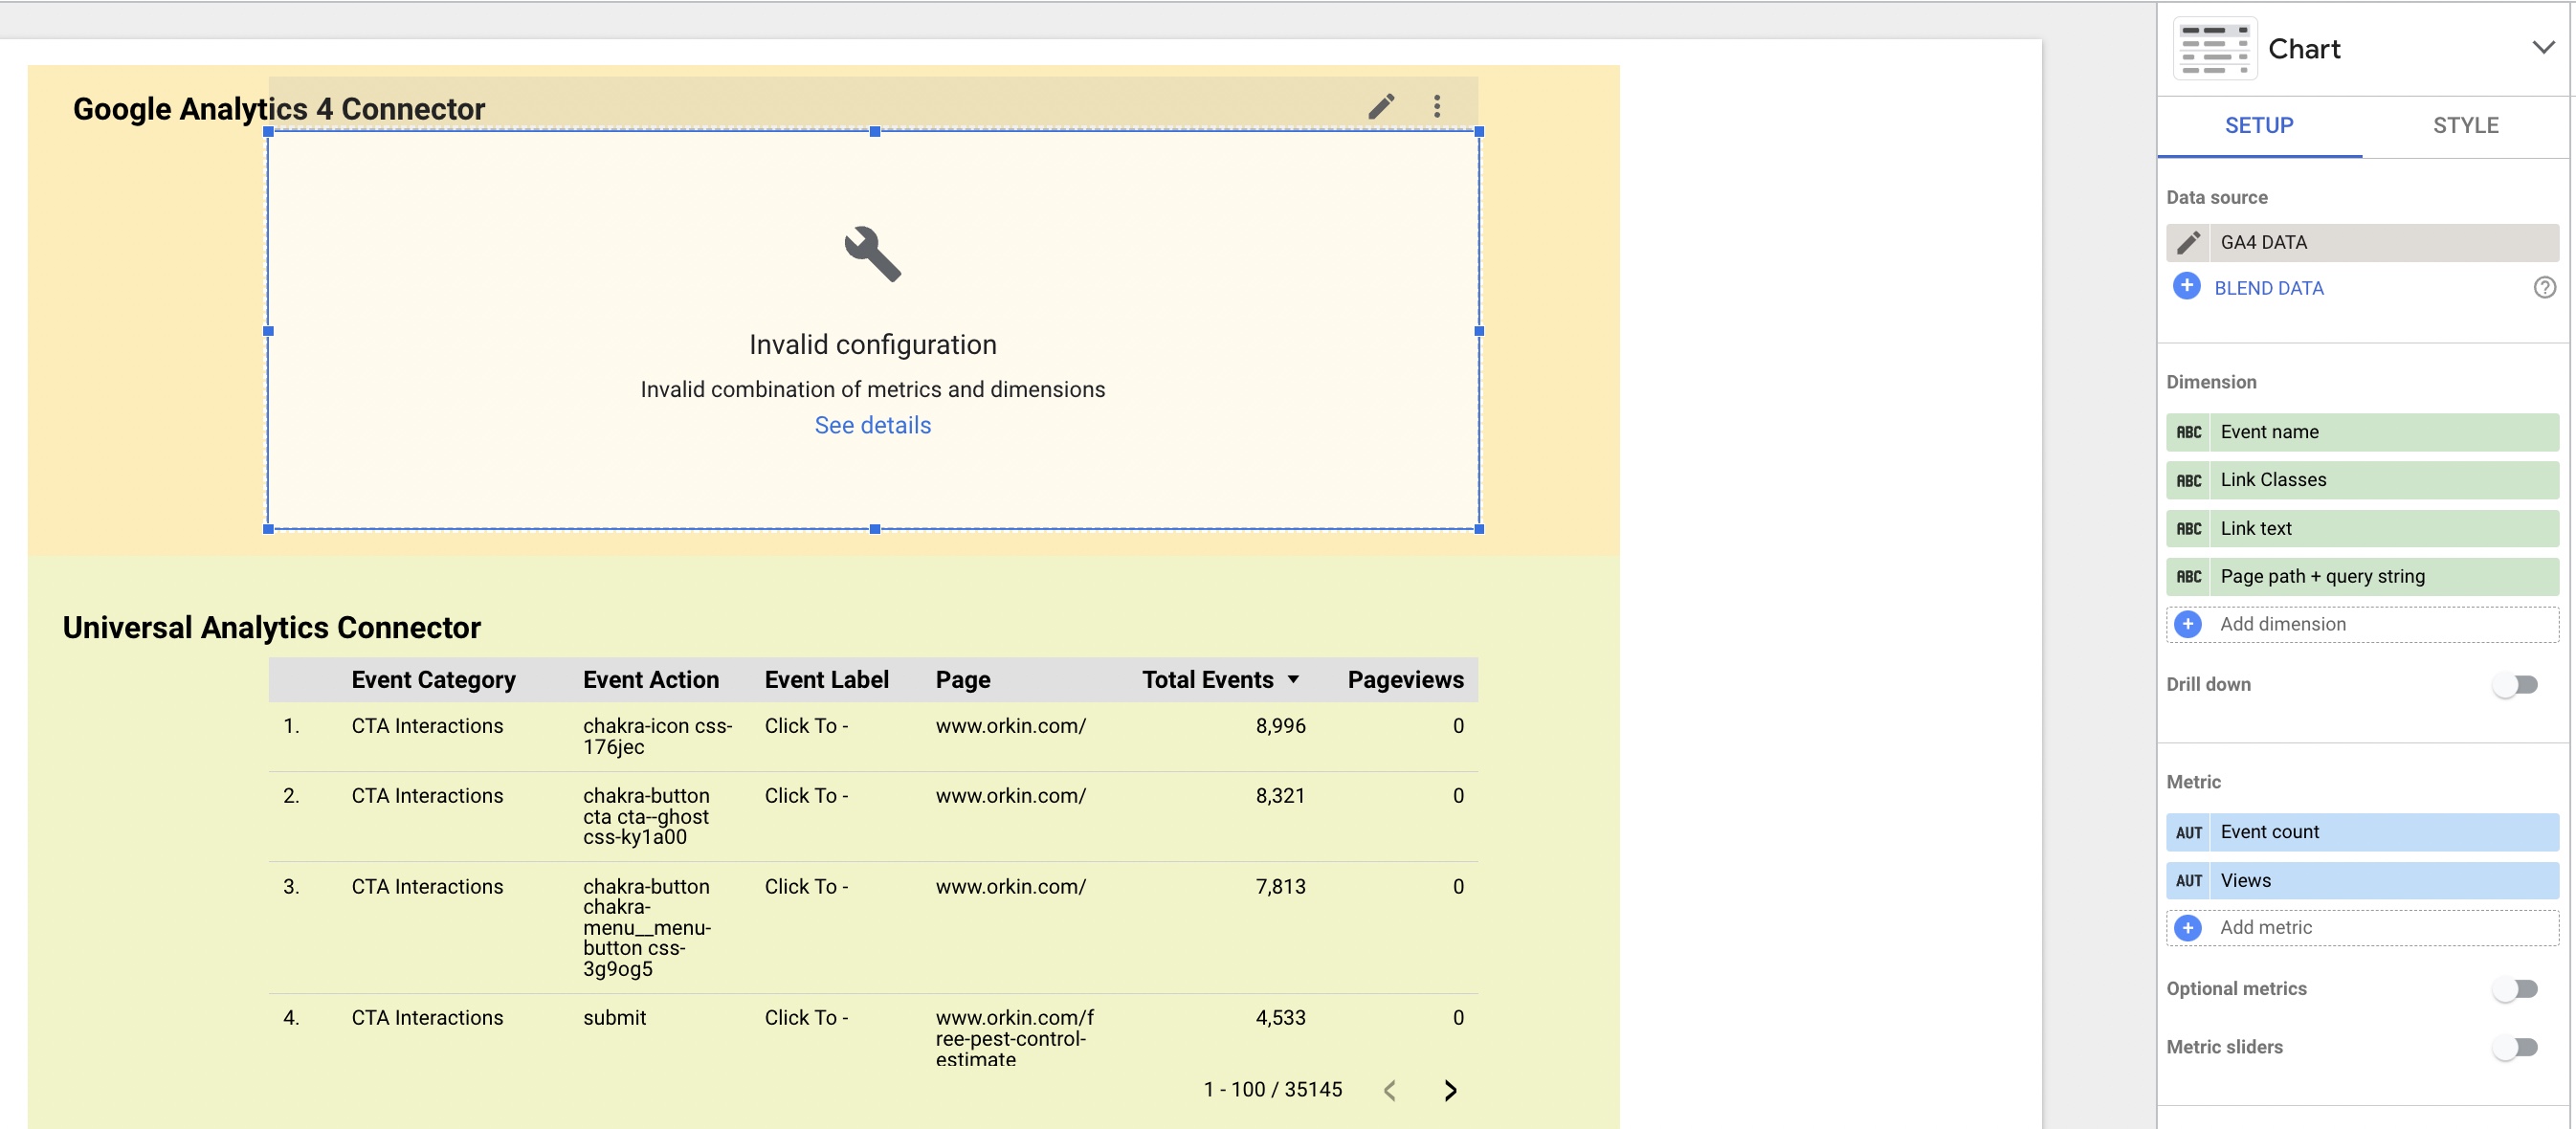
What this means is that for whatever dimension & metric combination that is leveraged for reports in the GA4 interface or for Looker Studio dashboards, there is the need to ensure that they follow a similar scope. If they don’t follow similar scoping, you may encounter the dreaded “broken visual” dialog box which will pop-up when the scoping is a mismatch between the dimensions & metrics that were selected to visualize.
Tip: When building reports in Looker Studio using GA4 data, be patient, and play around with what works with one another. Double check what dimensions & metrics may go together, consider comparing against the default reports within the GA4 interface, known as the Lifecycle reports.
UA vs GA4: Beware of Discrepancies, and How to Combat Them
Once you start digging into Looker Studio dashboards for migrating your Universal Analytics versions of reports to the GA4 data source connector you may notice some data discrepancies - which in some cases is a given due to the new data model. Something to be aware of is that these GA4 dashboards could uncover some implementation issues from the migration process. This is where developing a UA to GA4 dashboard to visualize the percent change from implementation is recommended to accurately measure and understand the reporting differences if they arise.
A great solution would be Krista Seiden’s Migration Monitoring Dashboard.
Get Started With Your Dashboard Migration with GA4 Data
At this point, you should be more informed about the Google Analytics 4 data source connector within Looker Studio to be able to create new and replicate your favorite UA dashboards. The main item to note is that GA4 is constantly changing, adding new features, the addition of new dimensions and metrics, and so much more. This is an exciting time within analytics and it’s important to stay current with the latest and greatest, and to continue leveraging not only the GA4 interface, but also GA4 data to leverage for reporting and analysis.