Eight Tools for Debugging your Adobe Launch Implementation
It is a maxim of technology that something will go wrong, even more so if that technology is esoteric, specialised or not available to the public. The same applies to your Adobe Launch implementation. Fortunately, there are a wealth of tools to solve the problems you may run into. Here are some tools and methods that I regularly use as an Analytics Engineer in the Adobe suite of Analytics tools which I think you will find helpful as well.
This article is targeted towards:
- Web Analytics Engineers
- those using tag managers (especially Adobe Launch)
- those working adjacent to Adobe Launch
1. Use the Unminified Library
What is this method?
Using an extension to unminify the Launch library.
Why?
Launch minifies itself to reduce the load on the browser. However, this also makes the code less understandable; comments are removed, and variables lose their human-readable names. We can unminify the library to make the code more coherent.
So, the original code like this:
//  sensible names
var campaign = source + "," + medium + "," + term;
…may be transformed into this:
//  nonsensical names
var a=b+","+c+","+d;
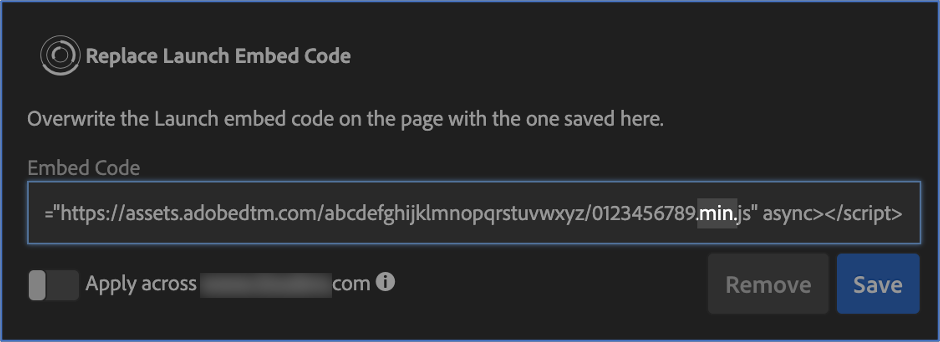
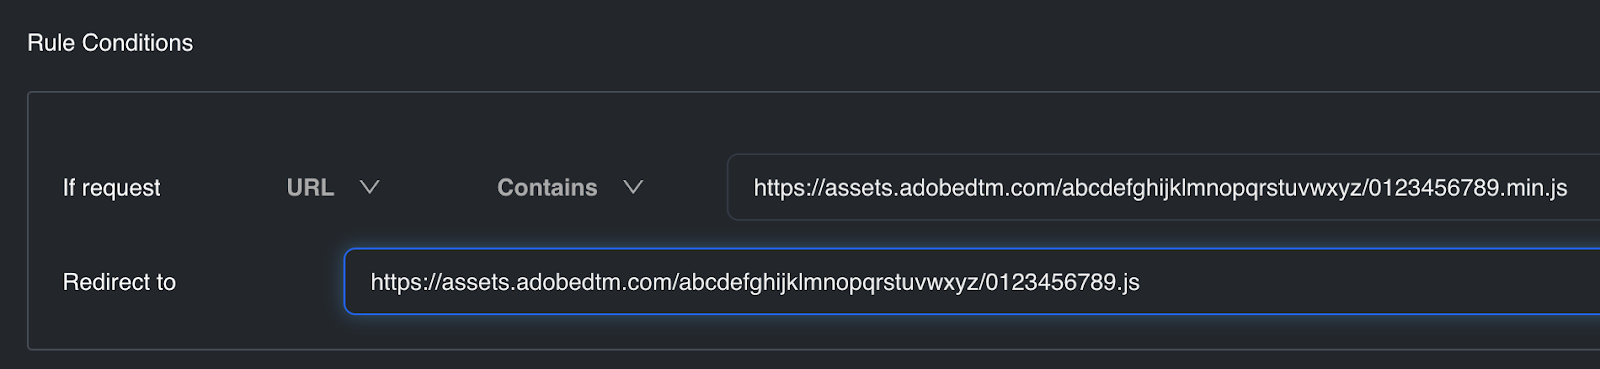
Use a chrome extension like Adobe Experience Cloud Debugger or Requestly to replace the minified library with the unminified library.

Simply remove the ".min" in the URL and you will see the sensible names return.
Adobe Experience Cloud Debugger:
2. Using Chrome's Source Search for Debugging
What is this method?
A tool to search through all files loaded from the site.
Why?
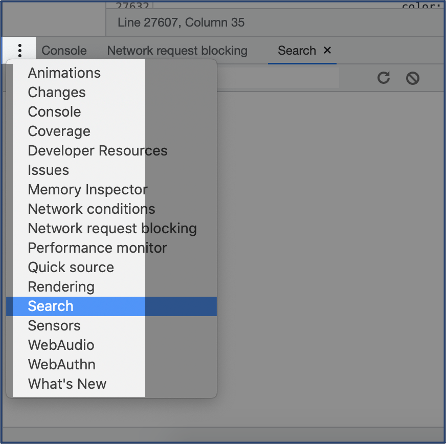
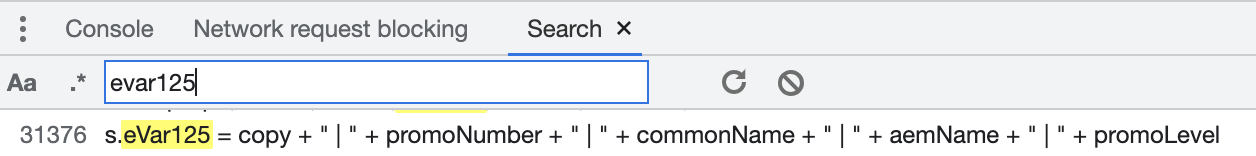
You can, of course, use CTRL+F to search through a file – but there is an even greater search tool in Chrome. In the Console drawer, there is a tab called "Search". This lets you search through all sources loaded by the browser.
This can make it much easier to discover:
- where a rouge event is being set
- what code is causing an error
3. Live Expressions
What is this method?
A tool that tracks an expression value.
Why?
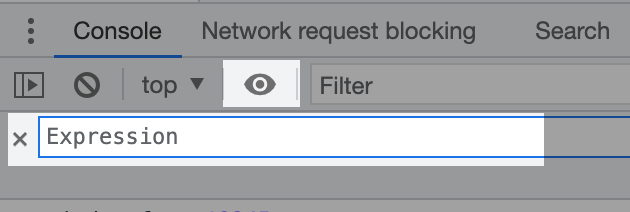
Live Expressions are a fantastic tool to understand an expression's value. The value is updated in real time. There is no need to type-out the value in the console.
Navigate to the console and click the eye icon. The expression field will be routinely evaluated every moment.
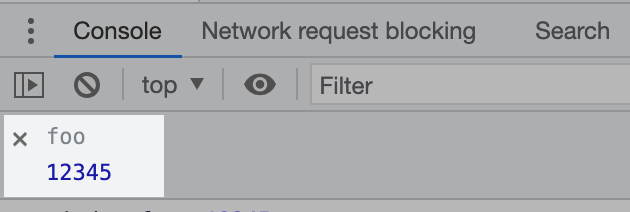
In this example, any time the foo variable is updated it will be reflected here.
I recommend the below when interacting with several Launch environments.
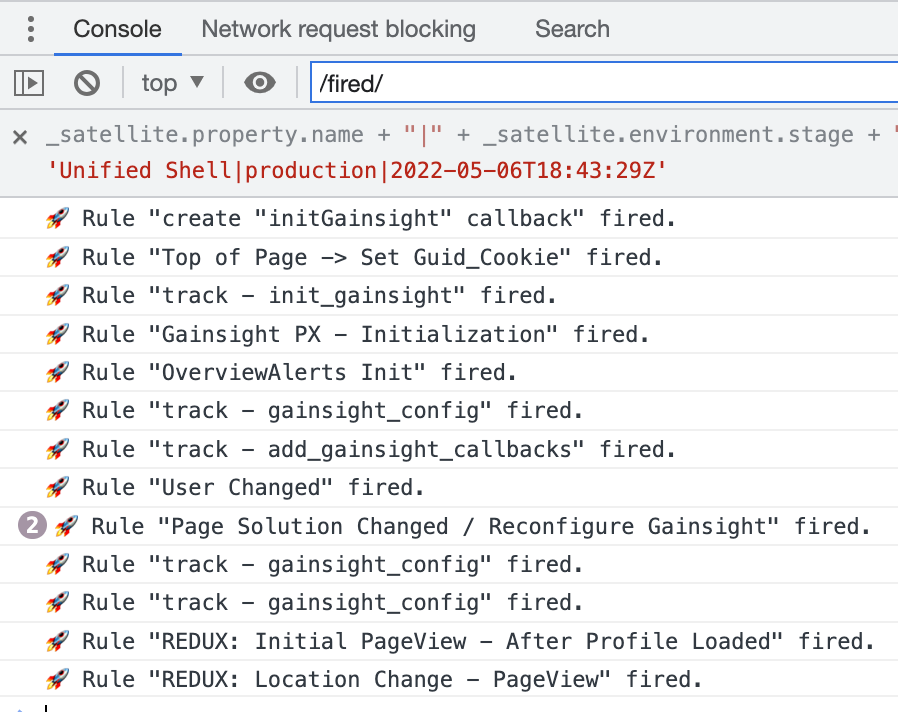
_satellite.property.name     + "|" +
_satellite.environment.stage + "|" + _satellite.buildInfo.buildDate
4. Break Points and The Debugger Statement
What is this method?
Break points and getting around barriers to break points.
Why?
Break points in any coding discipline are essential if a script is not behaving as expected.
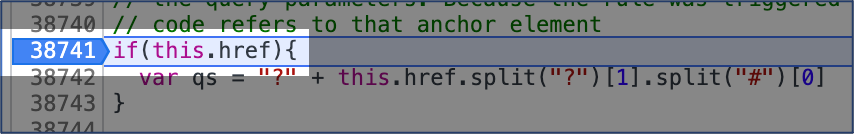
In some cases, you will be able to set a breakpoint in Launch without issue:
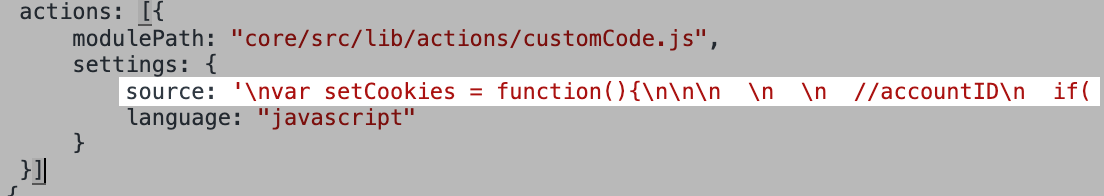
However, Launch has different ways of packaging your code (the logic of which is beyond my understanding). If Launch has packaged your code as in the image below, you will not be able to set a breakpoint in the browser:
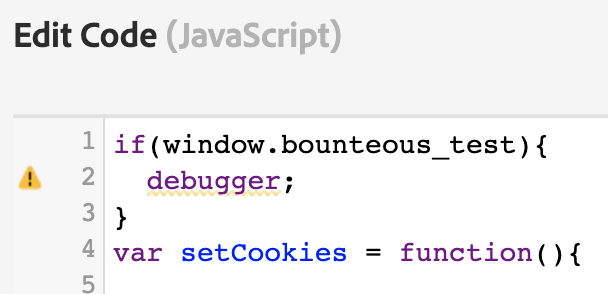
To get around this, let's put a debugger statement directly into the code (let's also put in a condition so that it won't affect anyone else using the environment):
As in tip #3, let's set a live expression to trigger the above condition.
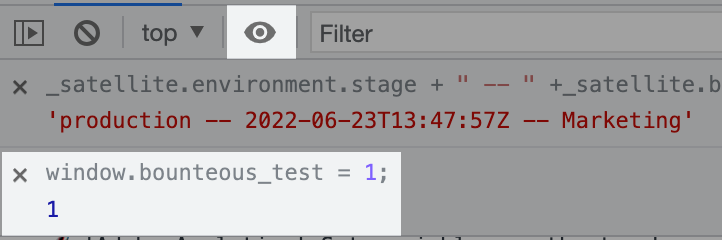
Reload the page and -- Voila! You are now able to go step-by-step through your code.
5. Three Important Values
What is this method?
Using three values that identify the current Launch library and tracking them in Adobe Analytics.
Why?
In tip #3 I introduced these values in the _satellite object:
_satellite.property.name

_satellite.environment.stage

_satellite.buildInfo.buildDate
property.name …is the name of the Launch container.
environment.stage …is this a development, staging, or production environment?
buildInfo.buildDate …is the time the library was last modified.
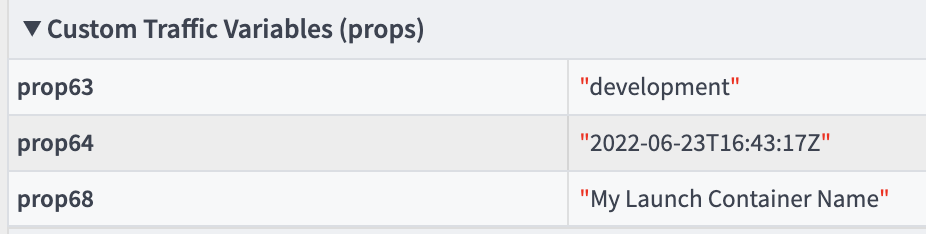
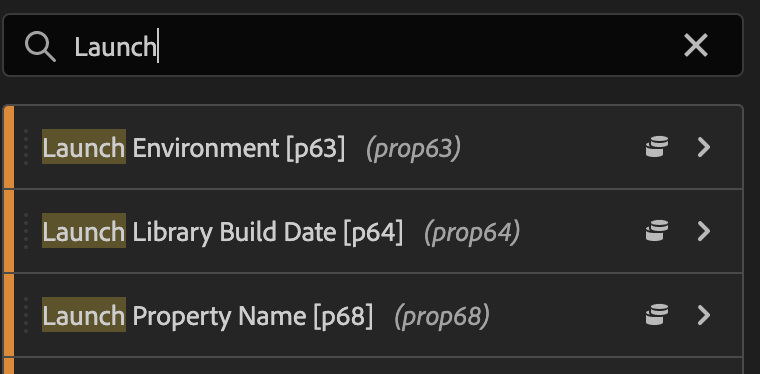
Often debugging extends beyond the browser. You may find these come in handy in Adobe Analytics when investigating a problem. In particular I have found them helpful when debugging campaign information. I recommend setting these as props on every beacon:
6. Checking Which Rules Are Firing
What is this method?
A simple way to check which Launch rules are firing.
Why?
Maybe there's an eVar missing. Maybe there's an error. If a rule is not firing, there could be a simple reason why.
To see if a rule is firing, simply filter the console with the value /fired/. If you are not seeing any rules, you may need to turn on debug mode with:
_satellite.setDebug(true);
Also be sure to check for errors (and that you're not filtering them out).
Did you know that Launch is installed inside the Launch interface? Here's a peek at what's going on in there:
7. Understanding what is in Production
What is this method?
How to understand the difference between what is live on the user-facing website vs. what is in Launch's working library.
Why?
If something is going wrong with a rule, it is instinctual to click Rules and go to the rule. The problem is that this does not necessarily reflect the version of the rule that is in production and can lead to misunderstandings.
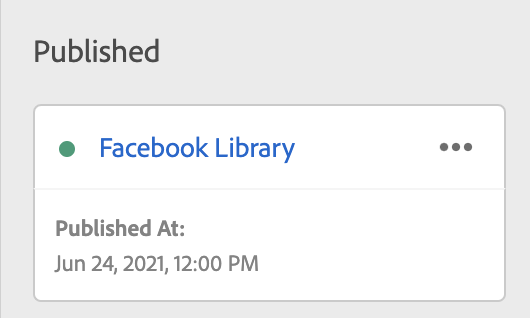
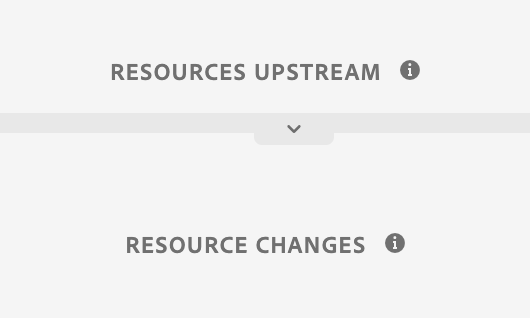
If you want to understand what is in Launch's production environment, click on the library that was published most recently. You will find it at the top of the "Published column".
Under "Resource Changes" click the rule you're interested in. This is the version of your rule that is LIVE in production.
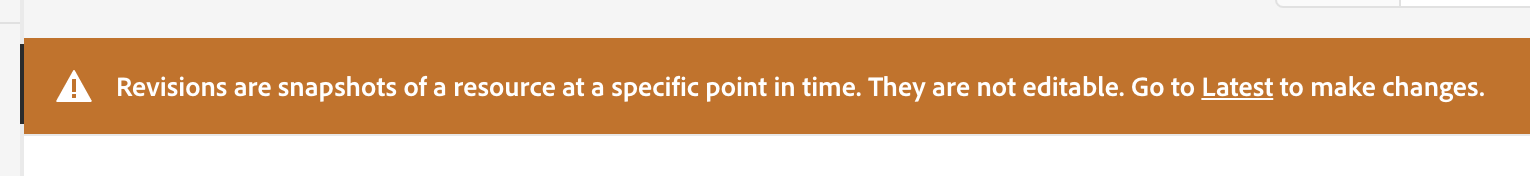
You will also see this dialog. I click on this by muscle memory -- but it's important to know that will take you to a version of the rule that is more recent than what is in production.
Now let's look at a practical example.
Imagine this: You published a library yesterday. The library sends a Facebook pixel on every pageview. Today, you realize the pixel is not firing.
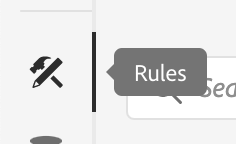
You go to the "rules" tab…
You check the rule…
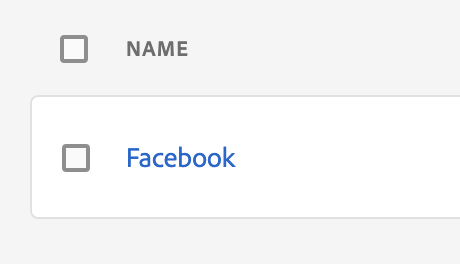
…but you see no issues with it. How could that be?
The mistake is that you are not looking at the version of the rule that is in production, you are looking at a more recent draft that has not been published.
8. Overrides
What is this method?
A tool that can rewrite pages.
Why?
Overrides are a powerful tool. Put simply, they allow you to rewrite a page. Unlike using the inspection tool, these changes will persist even after reloading the page. This may be helpful for tested proposed changes to the site.
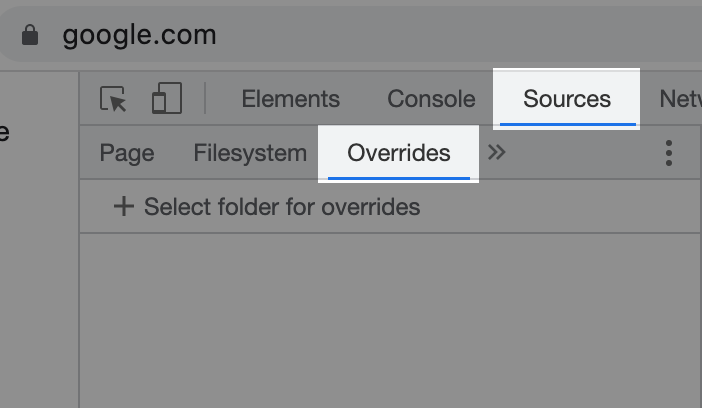
Under the Sources tab you'll find "Overrides".
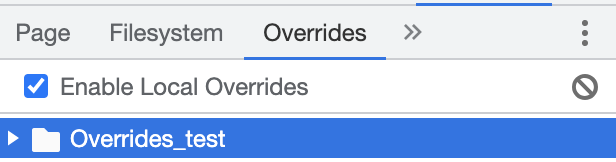
Select a folder to put your overrides in. Make sure that "Enable Local Overrides" is checked.
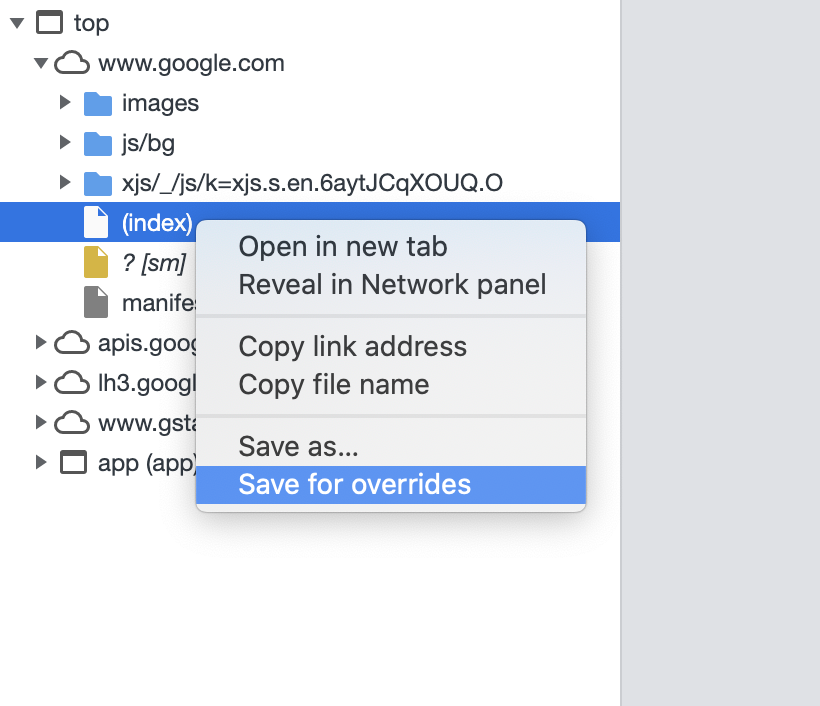
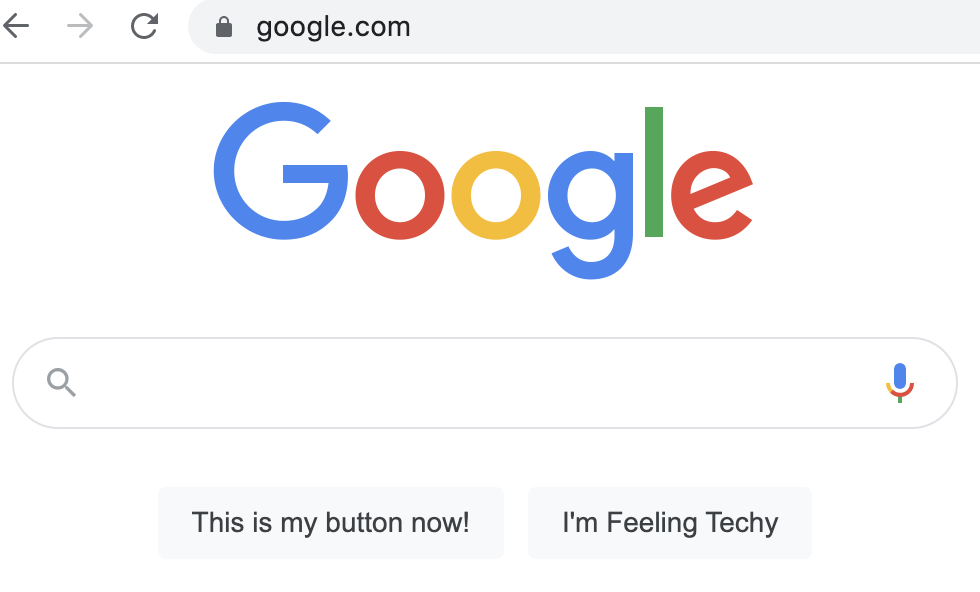
Go to "Page", right click the page you want to change and choose "Save for overrides".
Edit the page in the sources tab. Be sure to save with CTRL+S.
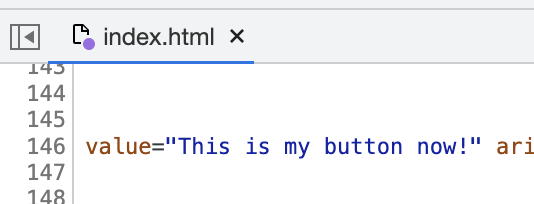
Then you can make this kind of magic happen!
Now let's look at a practical example.
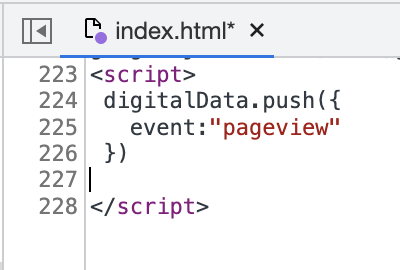
Let's say we've written an implementation guide (IG). That IG requests that a push is made to window.digitalData when a pageview happens. It looks like this:
digitalData.push({
  event:"pageview"
})
If we want to test that our Launch configuration is correct and compatible with the IG, we could simply paste this script into the console – but for a more realistic experience we could have overrides take care of this for us.
Now, we can have our pageview event trigger automatically on every pageview.
Keep the Eight Tools Handy
As you are working in Adobe Launch and the Adobe Analytics Suite, it is common that issues will arise that need fixed. Keep this list of eight tools in mind to help find bugs and solve problems you run into.